Media Mapping of Jamia's Neighborhood

Centre for Culture, Media and Governance
Jamia Millia Islamia, New Delhi
Project: Media Mapping
Introduction:
Media Mapping is rapidly becoming increasingly important especially in the ever-changing Indian diaspora. It is a growing topic of research which studies our behaviour and outlook towards media and in what ways human society changes or adapts to the intricacies of media.
Conceptual Framework:
This project of media mapping of Jamia neighbourhood employs primary data collected during the years of 2009-2013 and 2018. The research conducted during these years have been analysed, interpreted and presented here in the form visualisations with the help of Tableau. The project aims to analyse the specific areas of Jamia locale in terms of data with respect to media devices, their usage patterns and penetration.
Domains of concern:
- Photocopy machines
- Newspaper distribution
- Cyber Cafes
- STD/PCO booths
The visualisations employ a two-way approach towards analysing the data of research:
1. Media device based
2. Year based.
Using this approach helps us in presenting a better illustration of what the data conveys. Wherever it was possible to present a year-wise continuation of the visualisation, every effort has been taken to do so.
Instructions related to visualisations:
- Tabs embedded at the top of each worksheet contain a different visualisation related to the tab topic. Clicking on it opens it.
- Resizing the visualisation can be done according to preference.
- Tiles shown on the right side can be used to highlight a specific area.
- The 'share' button at the bottom right corner can be used to share the visualisation on other networks.
- The 'download' button the bottom right corner can be used to download the visualisation as an 'image' or 'pdf'.
*This is only a first-stage prototype. Any misrepresentation in terms of data, illustration or statistics is purely incidental and not intentional.*
Distribution of Cyber Cafe in Jamia Neighbourhoood (2012)
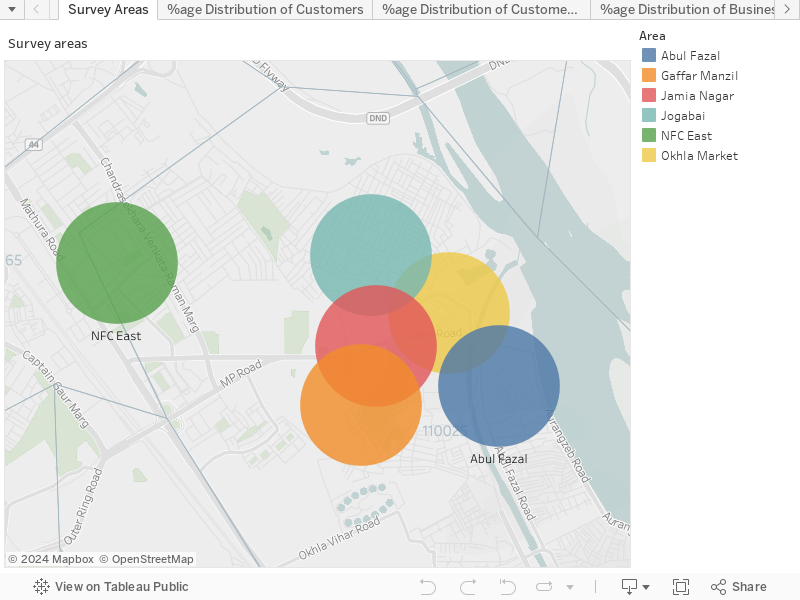
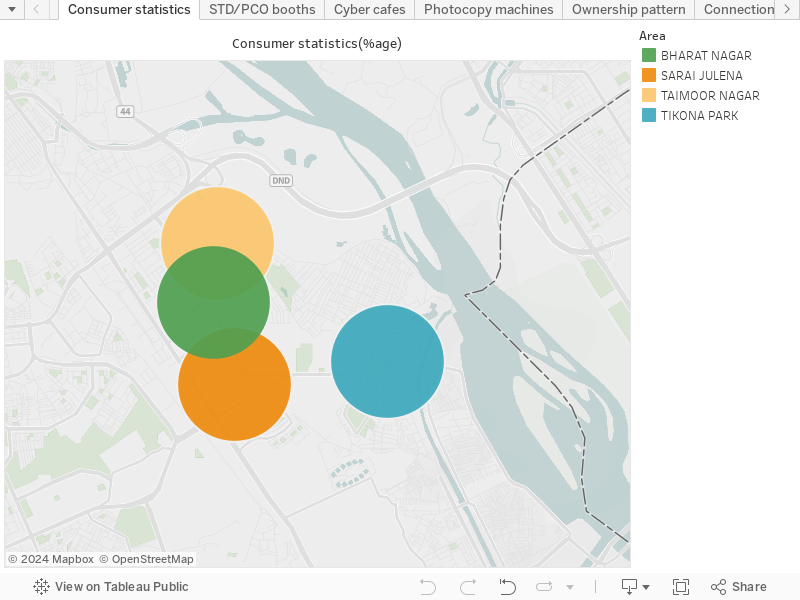
Media Cluster Atlas (2010)
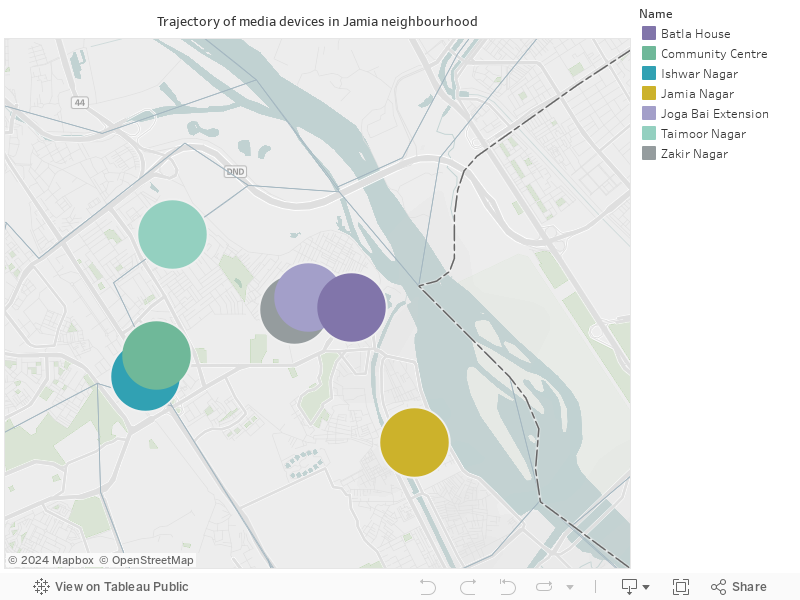
Trajectory of Media Devices
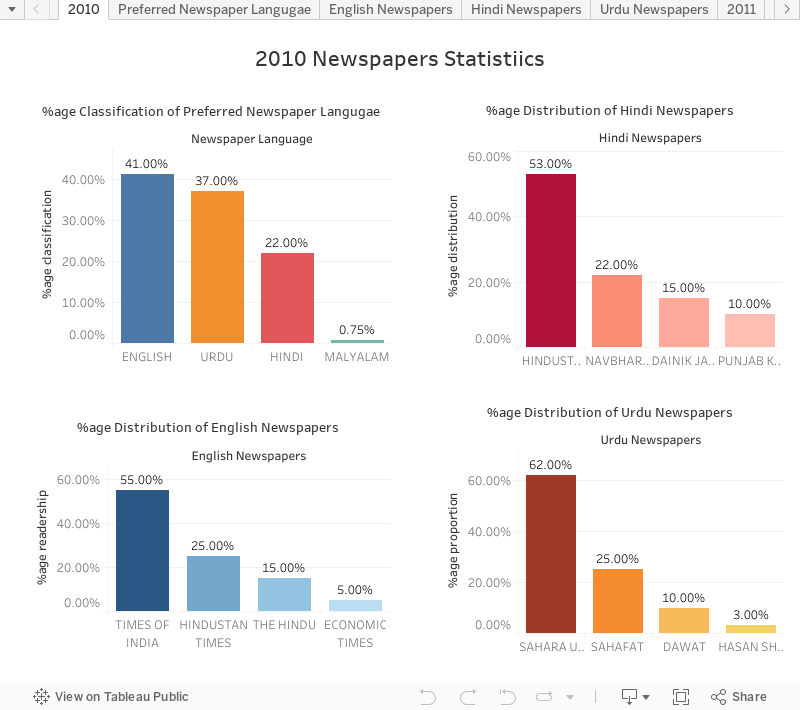
Newspaper Statistics (2010-2011)
Photocopy machines statistics (2011)
This visualisation shows interesting data related to photocopy machines in 2011. Use the tabs to open a diefferent visualisation.
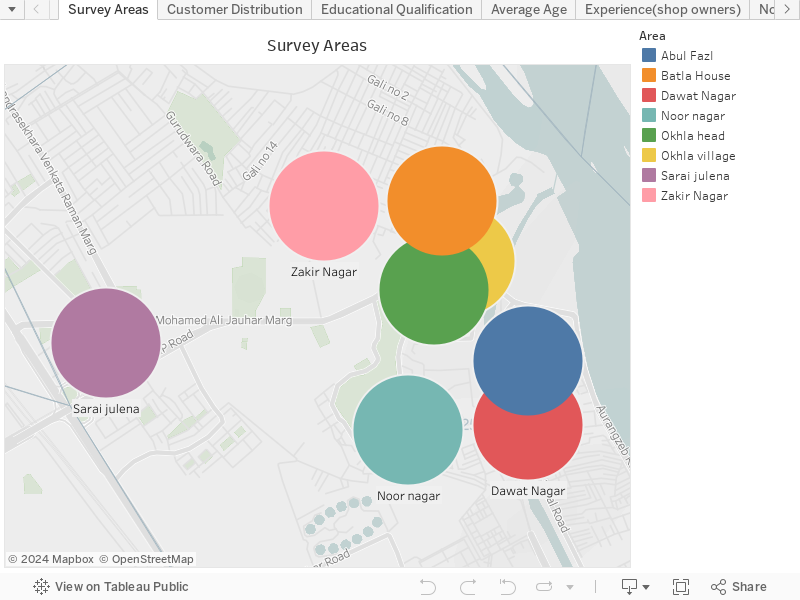
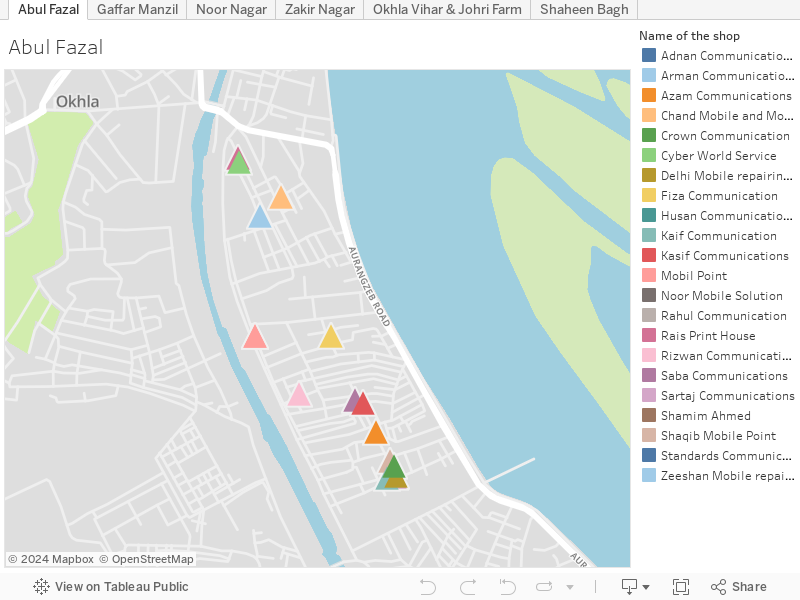
Map-based media mapping of shops (2018)
Comments
Post a Comment